Google AI Overviews: The Traffic Black Hole and Why Google Says It’s Actually Fine
Summary
Independent researchers keep shouting that Google’s AI Overviews are eating the web alive — or at least eating its clicks. Click-through rates are dropping anywhere from 15% to 70%, depending on which study you believe. Google, meanwhile, says: “Nah, traffic’s stable.” Which is technically possible, in the same way it’s technically possible your fridge is still full after someone ate half the cake — maybe you didn’t like that cake anyway.
The gap between Google’s cheery press lines and publishers’ revenue spreadsheets is widening. And for anyone making money on AdSense, that gap isn’t just academic. It’s the hole your income is falling into.
1. The Numbers (a.k.a. The Part You Can’t Spin Forever)
Let’s start with the heavy hitters.
| Research Org / Period | Keywords | Metric | Pre-AIO CTR | Post-AIO CTR | Change |
|---|---|---|---|---|---|
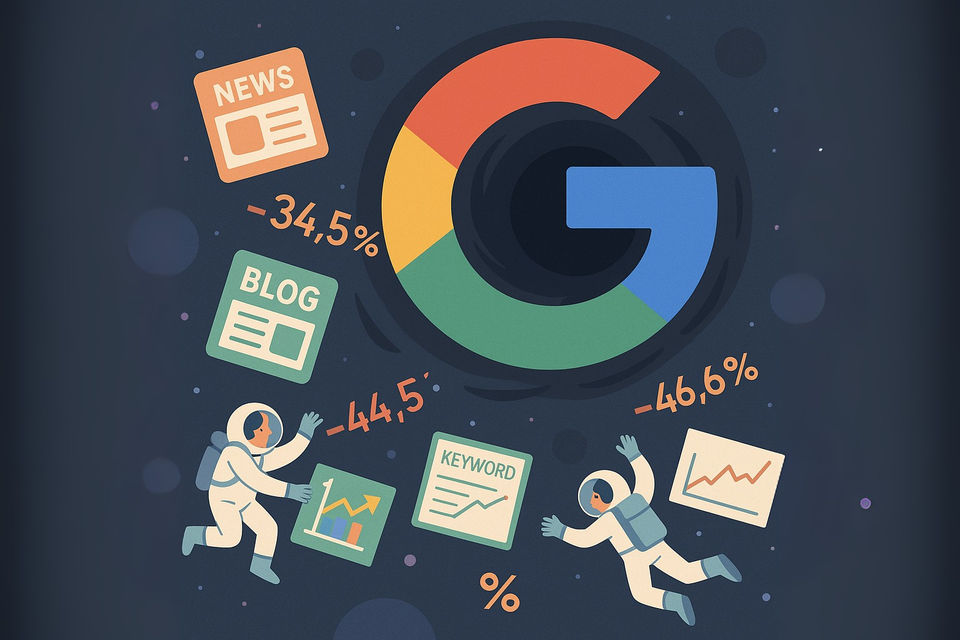
| Ahrefs (2024–25) | 300,000 | Pos.1 CTR | 28% | 18.35% | -34.5% |
| Amsive1 | 700,000 | Avg CTR | — | — | -15.49% |
| GrowthSRC | 200,000+ | Pos.1 CTR | 28% | 19% | -32% |
| Seer Interactive | — | Avg CTR | 4% | 0.6% | -54.6% |
| Pew Research | — | Click rate | 15% | 8% | -46.7% |
1 Amsive’s original study reported only percentage changes in CTR (e.g., -15.49% overall, -19.98% for non-branded keywords, -27.04% for non-top3 keywords), without publishing absolute pre/post CTR values.
Pew adds a human-level view: show people an AI summary and only 8% click through to a traditional result; hide the summary and 15% click. Links inside the AI summary? Just 1% click rate.
Zero-click searches — queries where the user never leaves Google — jumped from 56% to 69% year-over-year. In some industries, like healthcare and education, AI Overviews now show up in 90% of queries.